Economic Impact Tutorial
Tutorial overview
In this step-by-step guide, you will learn how to create a report as well as how to add key data points to the report that will help your business plan.
Related Resources
ImplanStep 1:
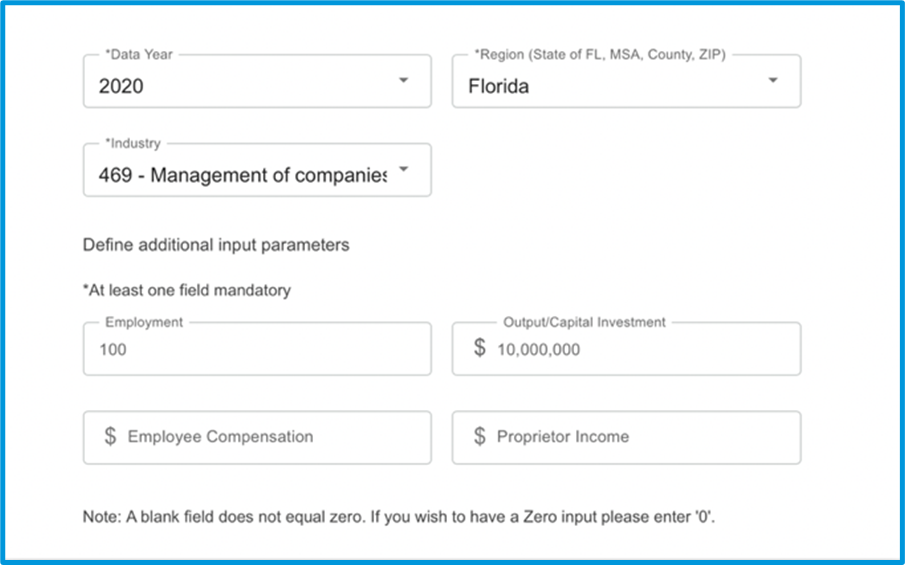
- In the “Data Year” box, choose the desired report year (between 2001 and 2020). It is important to complete this step first in order for the other boxes to populate.
- In the “Region (State of FL, MSA, County, ZIP)” box, choose the desired region. To reduce the number of options on the list, begin to type in the region you are looking for.
- In the “Industry” box, choose the desired industry. Only one industry may be selected. To reduce the number of options on the list, begin to type in the industry or 2-digit industry code you are looking for.
- Under “Define additional input parameters,” complete at least one box. Note that Employee Compensation and Proprietor Employment Income values are rarely known. If you do not know a value, leave the box blank. Only enter values, including zero, that you know.
- If completing the “Employment” box, enter the employment number.
- If completing the “$ Output/Capital Investment” box, enter the dollar value of Output/Capital Investment.
- If completing the “$ Employee Compensation” box, enter the dollar value of Employee Compensation.
- If completing the “$ Proprietor Income” box, enter the dollar value of Proprietor Income.
For example, please refer the image
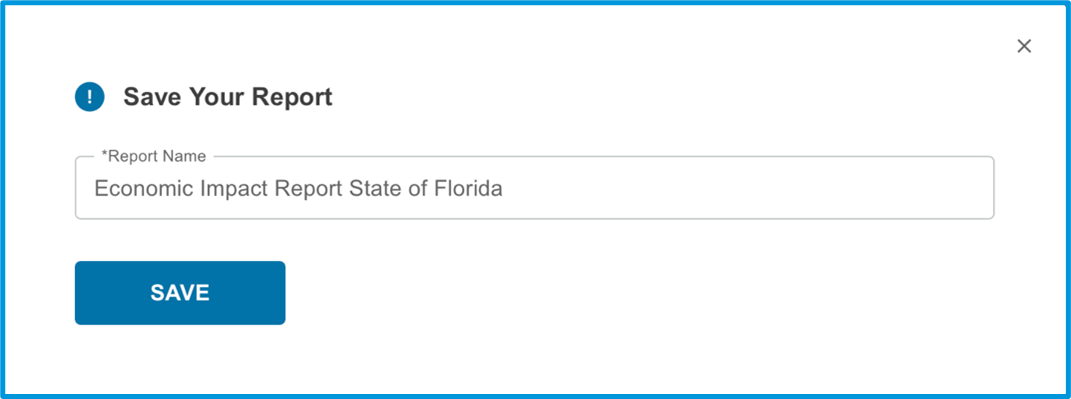
Step 2: Create and Save your Report
- Click the “NEXT” button to create the report. You may receive a pop-up that reads “Please wait while we are processing your request. This could take several minutes.” The following widgets will be included in the Economic Impact report:
- Economic Impact Highlights
- Economic Indicators by Impact
- Tax Results
- Click the “SAVE” button to save the report. You must name your report in order for it to save.
Step 3: Economic Impact process
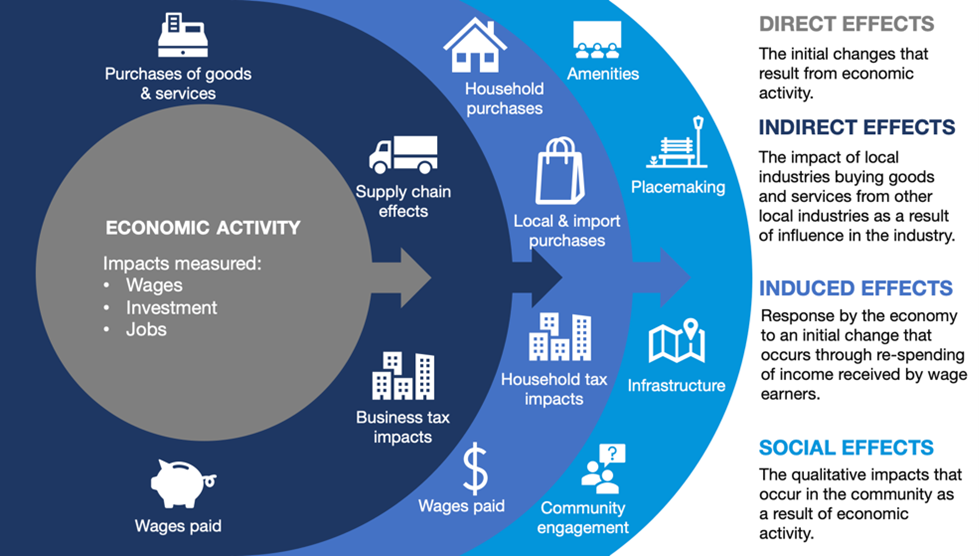
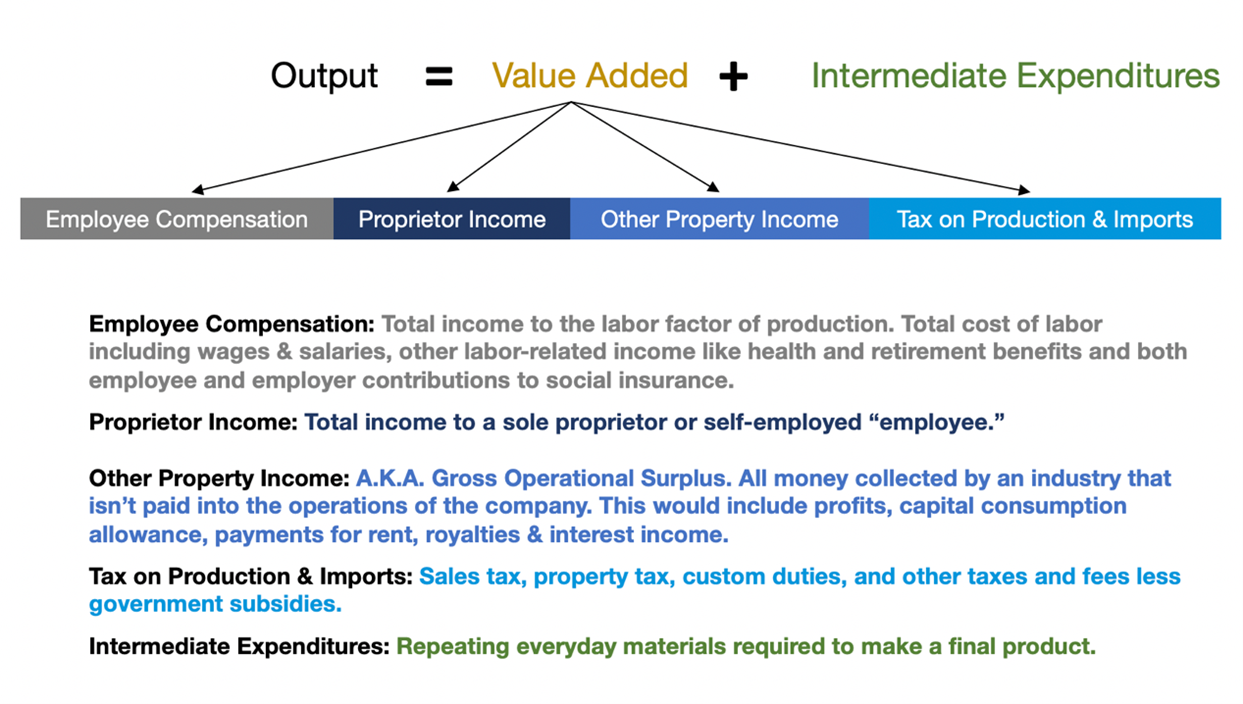
- The graphics describe and define the components of the Economic Impact process.